ProAccess: Analytics & Reporting Platform
A real-time analytics platform automating reporting workflows and data visualization to accelerate product decision-making.
WireframeShipped
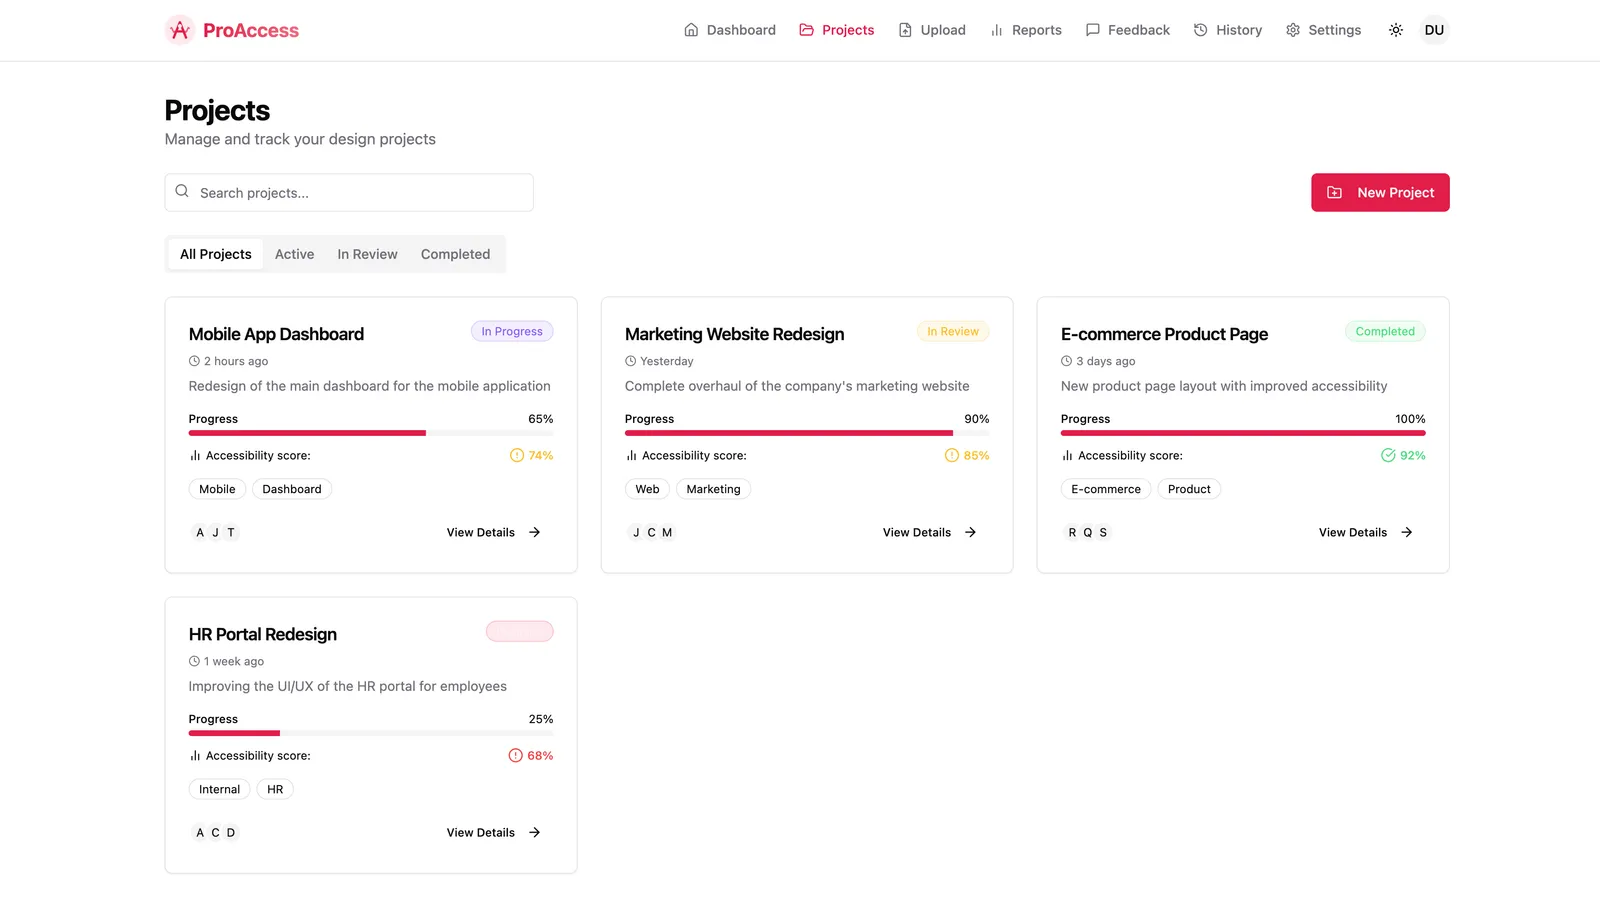
ProAccess is a comprehensive analytics platform I designed and developed to solve a critical challenge my team and I faced: making data-driven decisions quickly and efficiently. As a Product Manager working on multiple projects, I needed a centralized tool that could provide real-time insights, automate reporting workflows, and help us ship better products faster.
Working across various projects, my team was spending countless hours manually gathering data from different sources, creating reports, and trying to identify patterns that could inform our product decisions. This manual process was not only time-consuming but also prone to errors and inconsistencies.
ProAccess was born from this need - a modern analytics platform that provides businesses with comprehensive insights through real-time data visualization, automated reporting, and intelligent analytics. Since implementing ProAccess, our team has been able to:
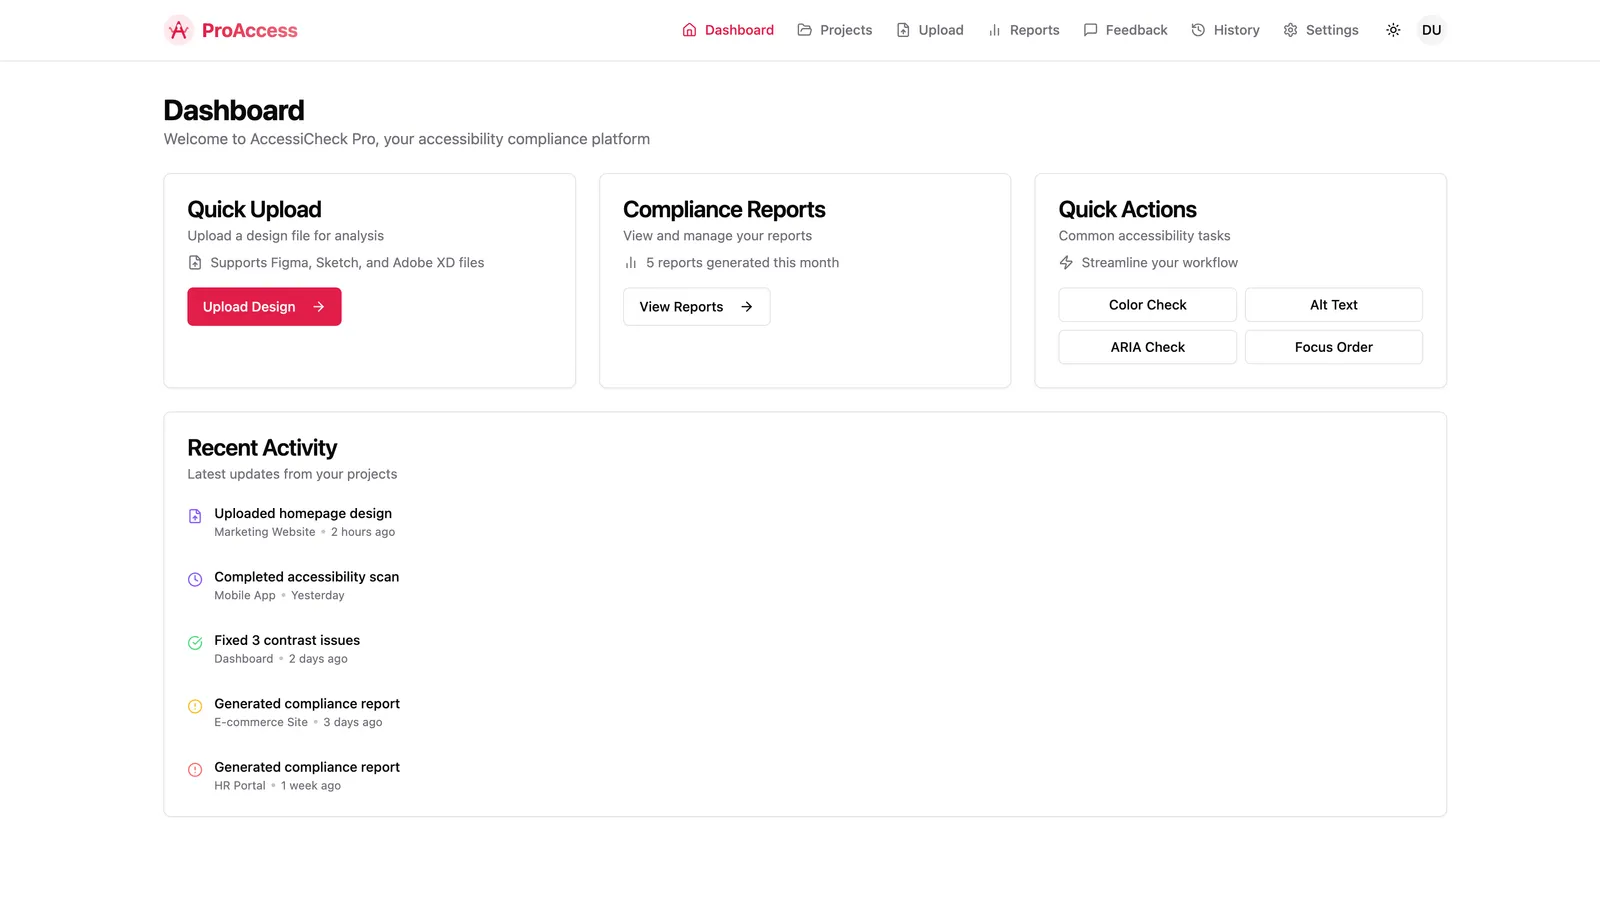 Modern analytics dashboard with real-time data visualization
Interactive charts and graphs providing deep insights into business metrics
Modern analytics dashboard with real-time data visualization
Interactive charts and graphs providing deep insights into business metrics
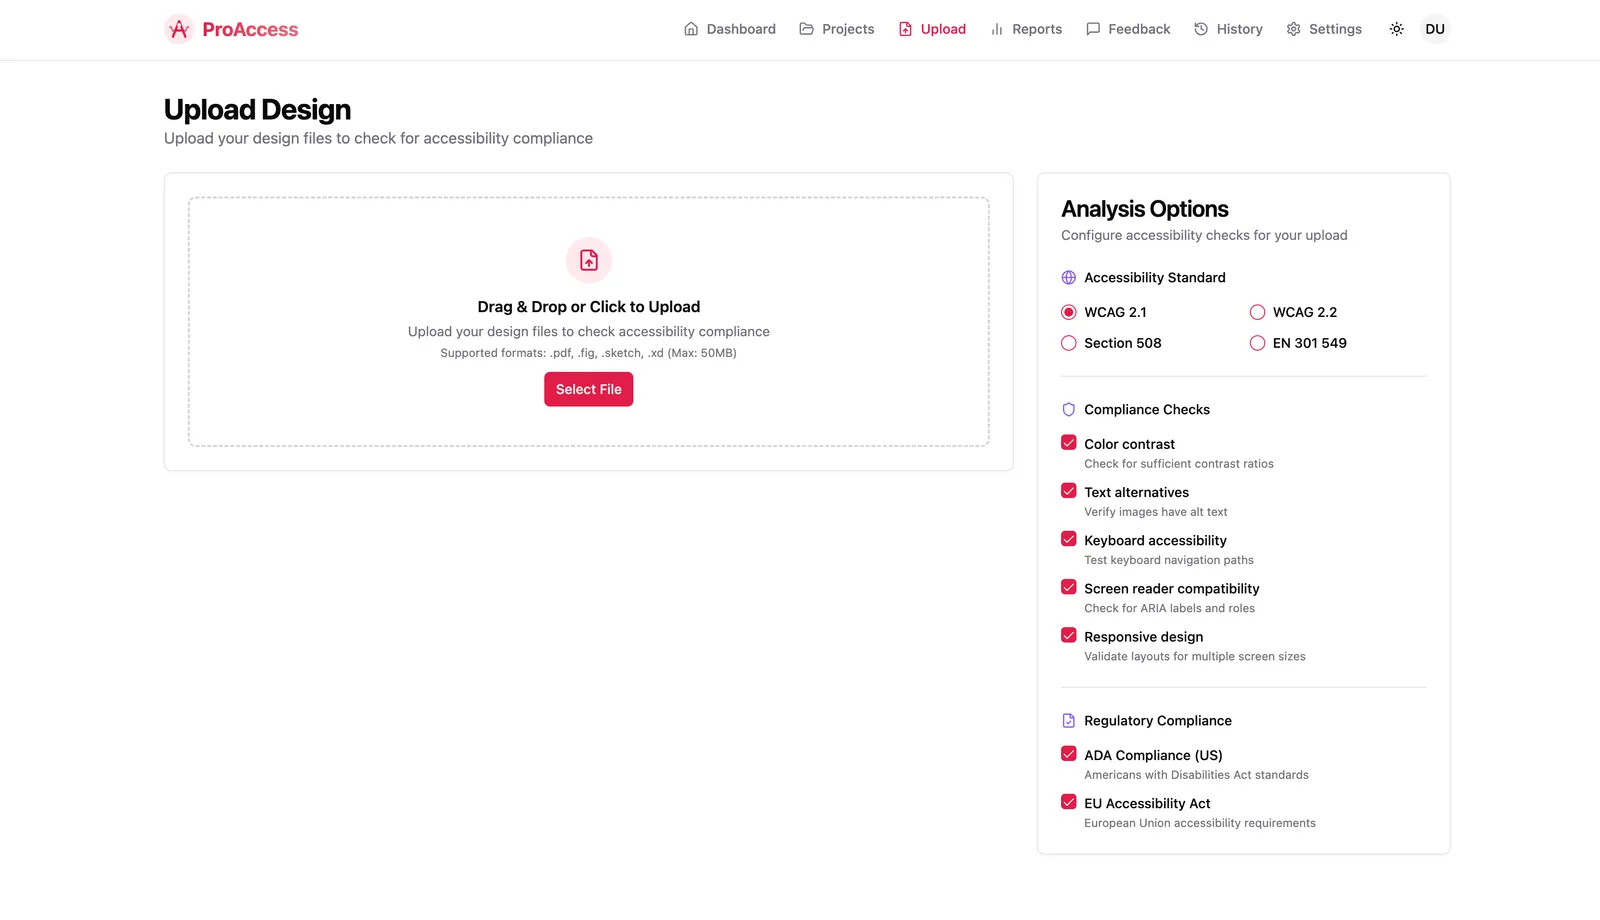 Comprehensive reporting interface with customizable parameters
The reporting system enables users to generate detailed reports with:
Comprehensive reporting interface with customizable parameters
The reporting system enables users to generate detailed reports with:
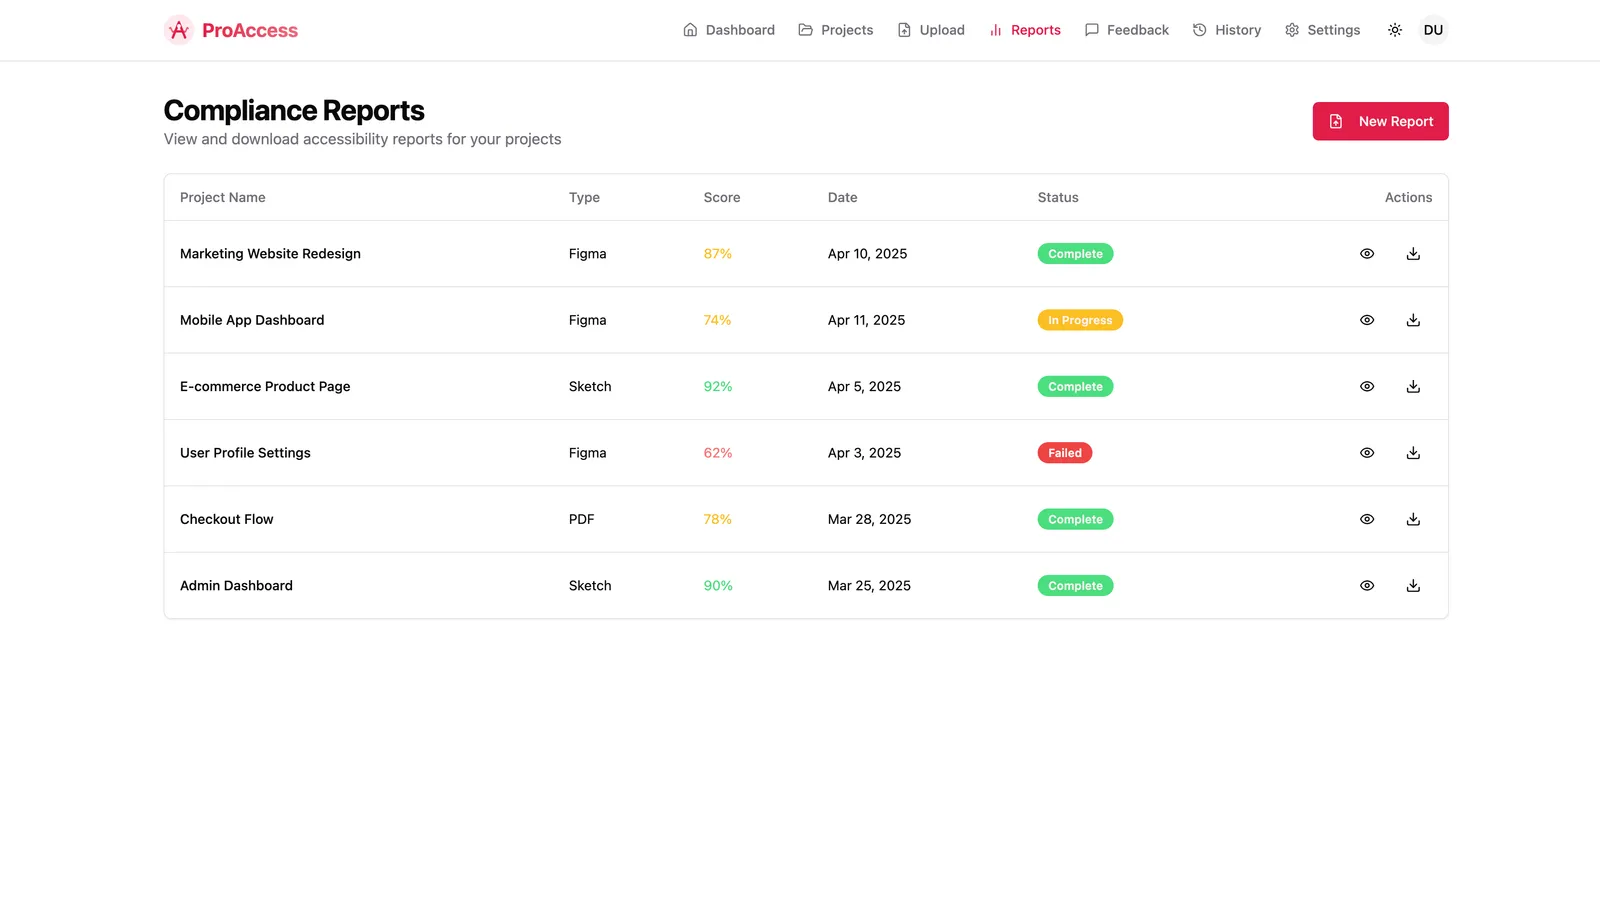 Performance metrics dashboard showing key business indicators
Track essential business metrics including:
Performance metrics dashboard showing key business indicators
Track essential business metrics including:
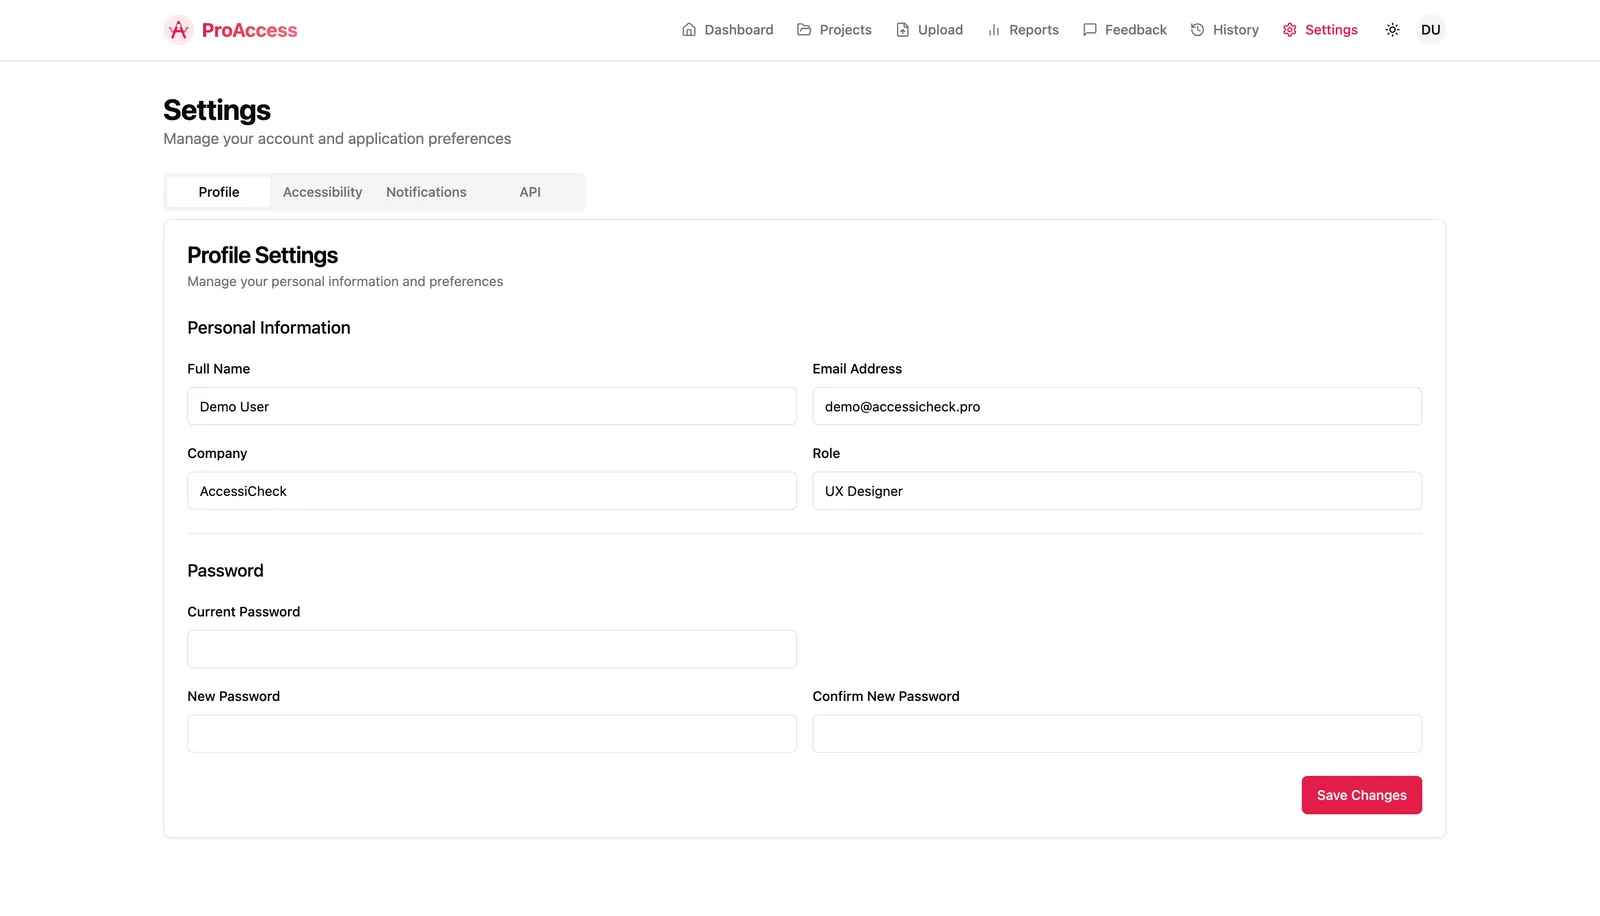 Data management interface with filtering and search capabilities
Robust data management features include:
Since deploying ProAccess for our team, we've seen significant improvements in our product development workflow:
Data management interface with filtering and search capabilities
Robust data management features include:
Since deploying ProAccess for our team, we've seen significant improvements in our product development workflow:
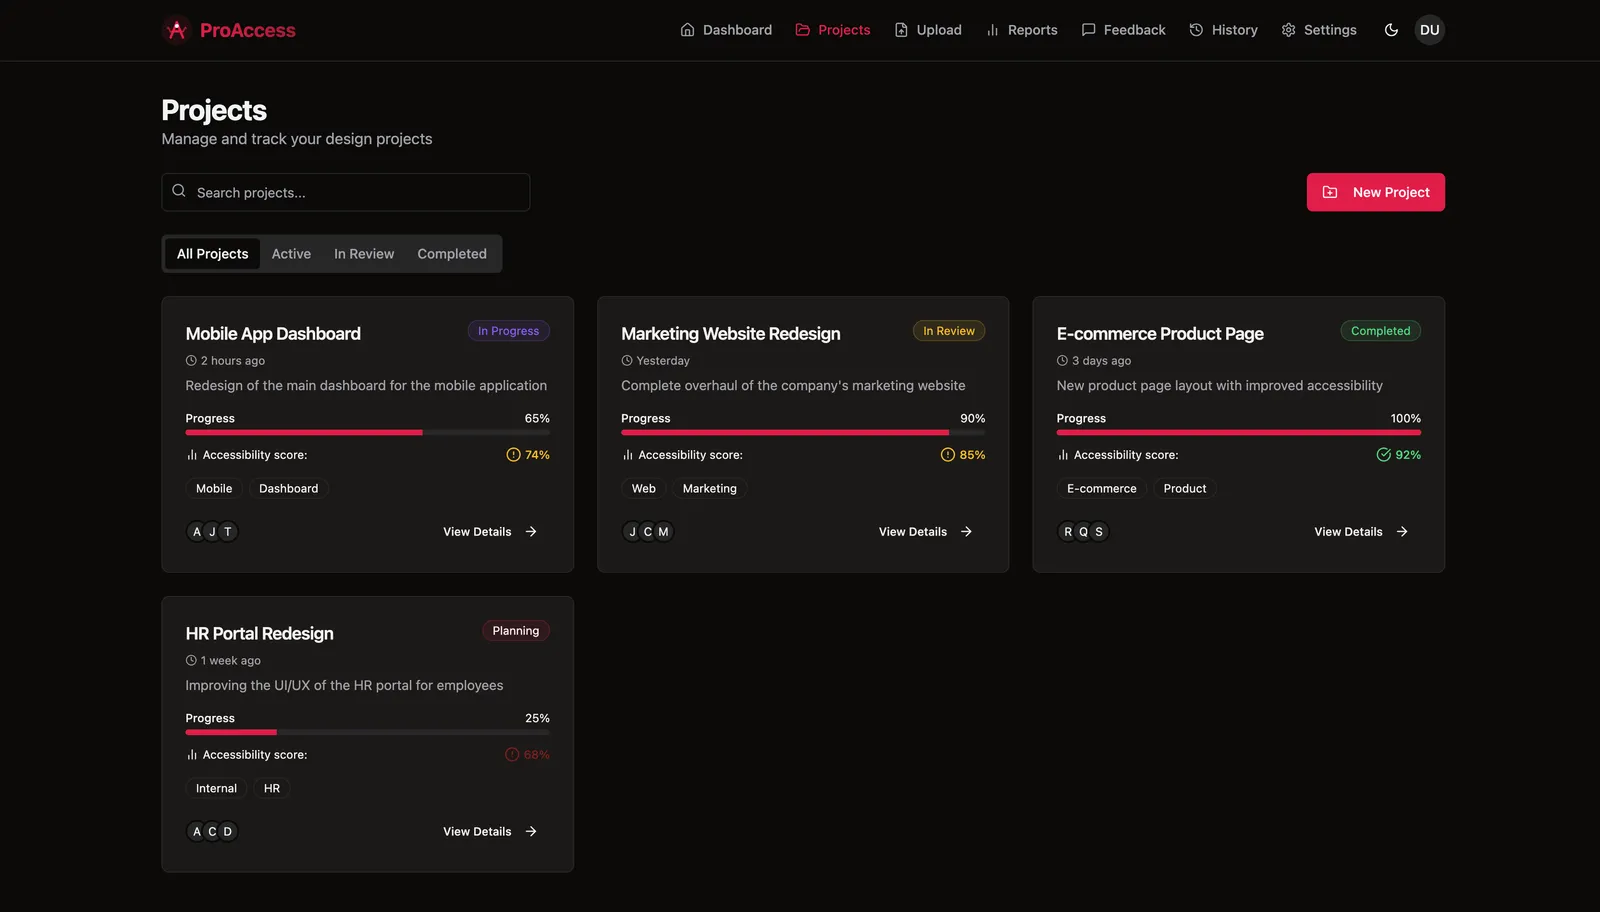 ProAccess technical architecture and component structure
Built with Next.js and React, ProAccess leverages modern web technologies to deliver a fast, responsive user experience. The platform uses TypeScript for type safety and maintainability, styled with Tailwind CSS for consistent design.
ProAccess technical architecture and component structure
Built with Next.js and React, ProAccess leverages modern web technologies to deliver a fast, responsive user experience. The platform uses TypeScript for type safety and maintainability, styled with Tailwind CSS for consistent design.
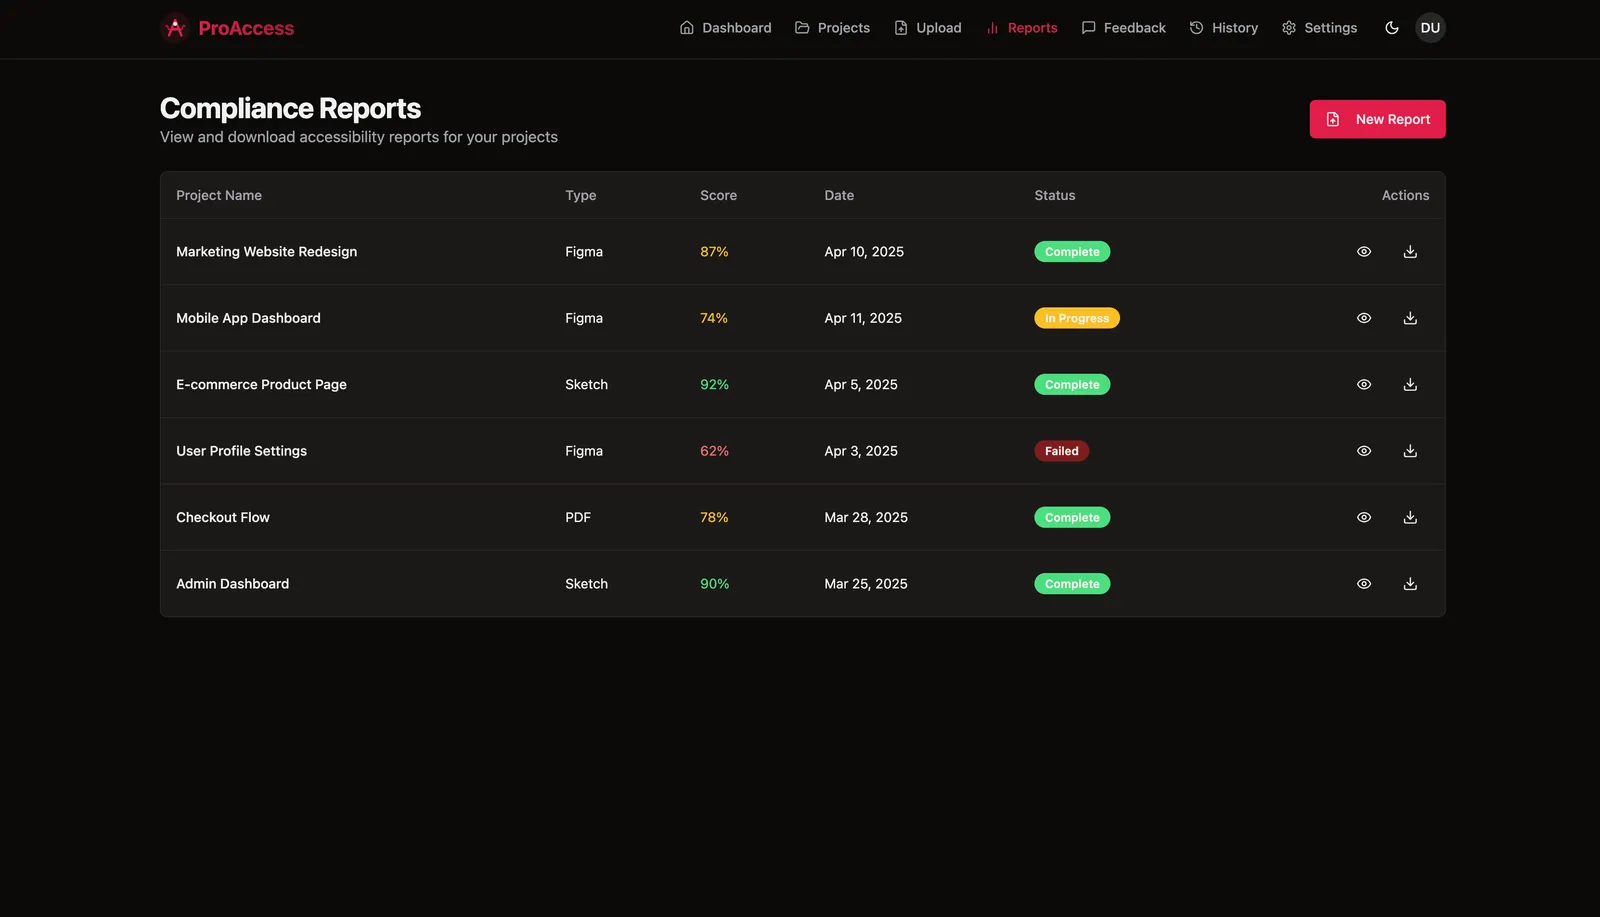 Advanced analytics engine with machine learning capabilities
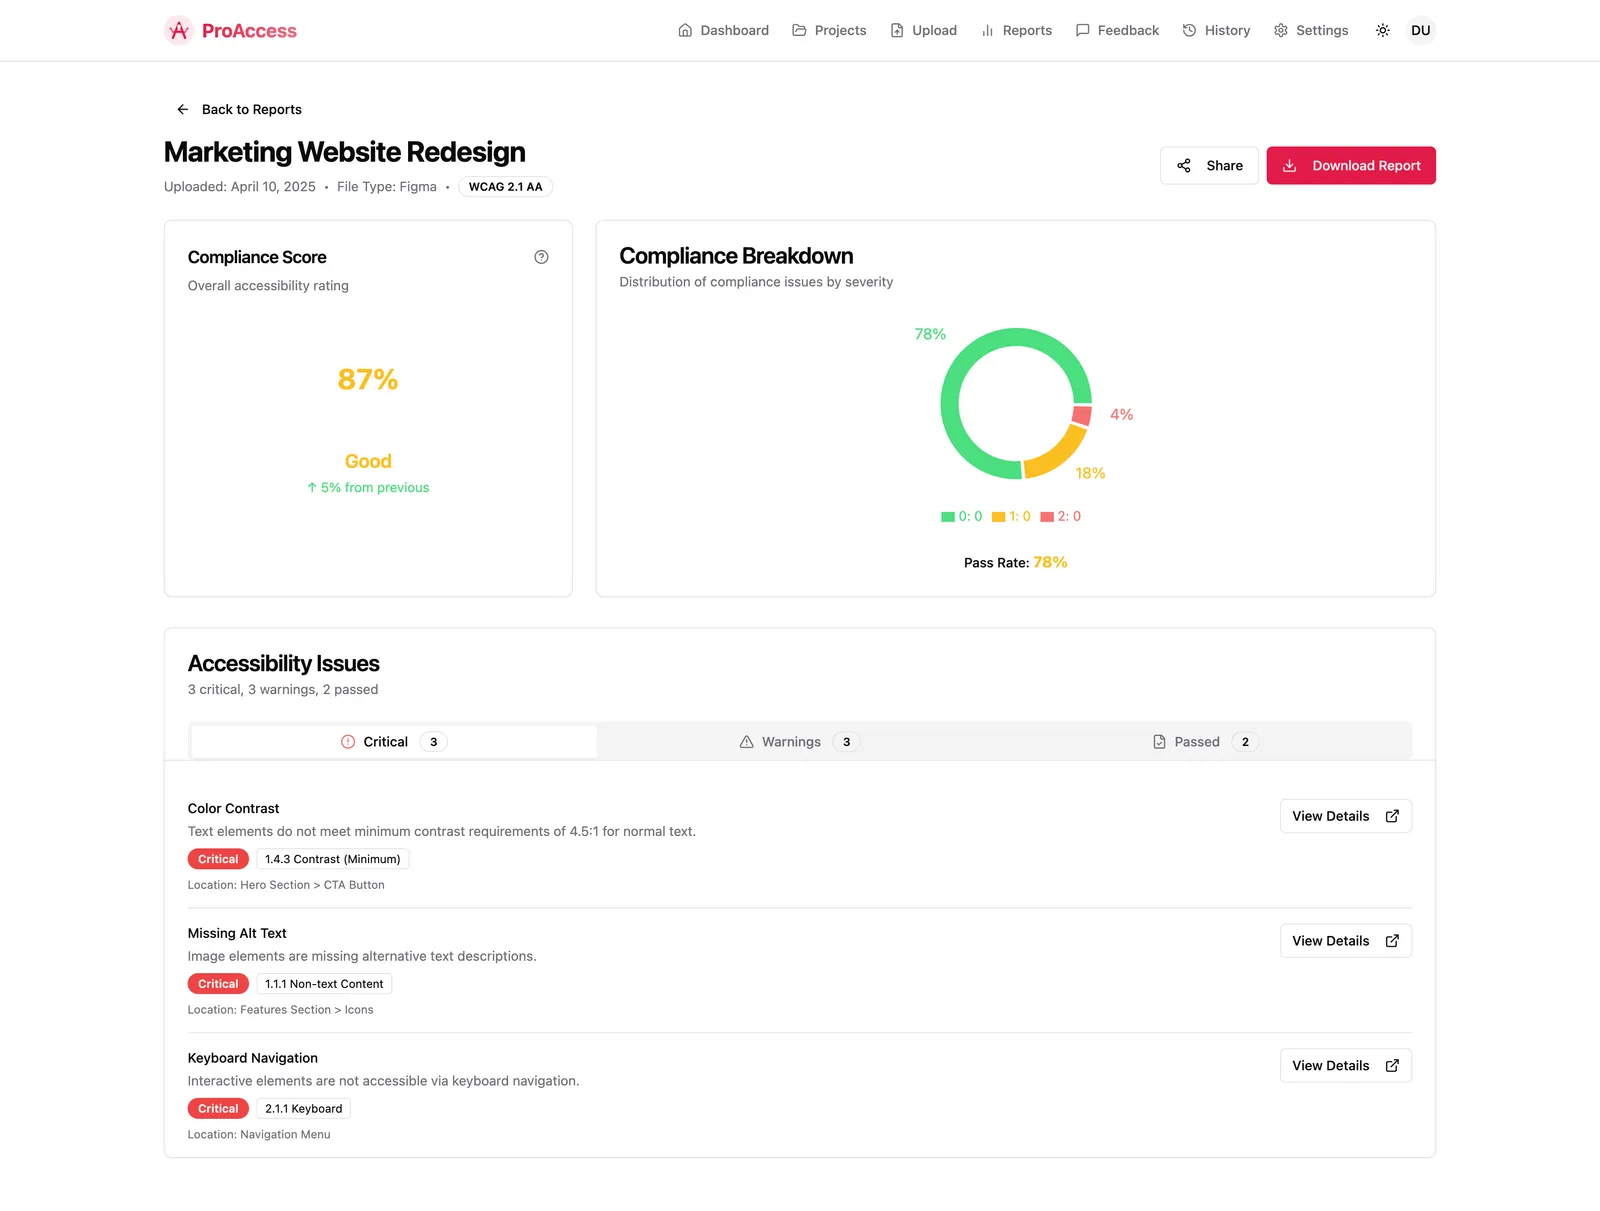 Comprehensive report view with detailed analytics and insights
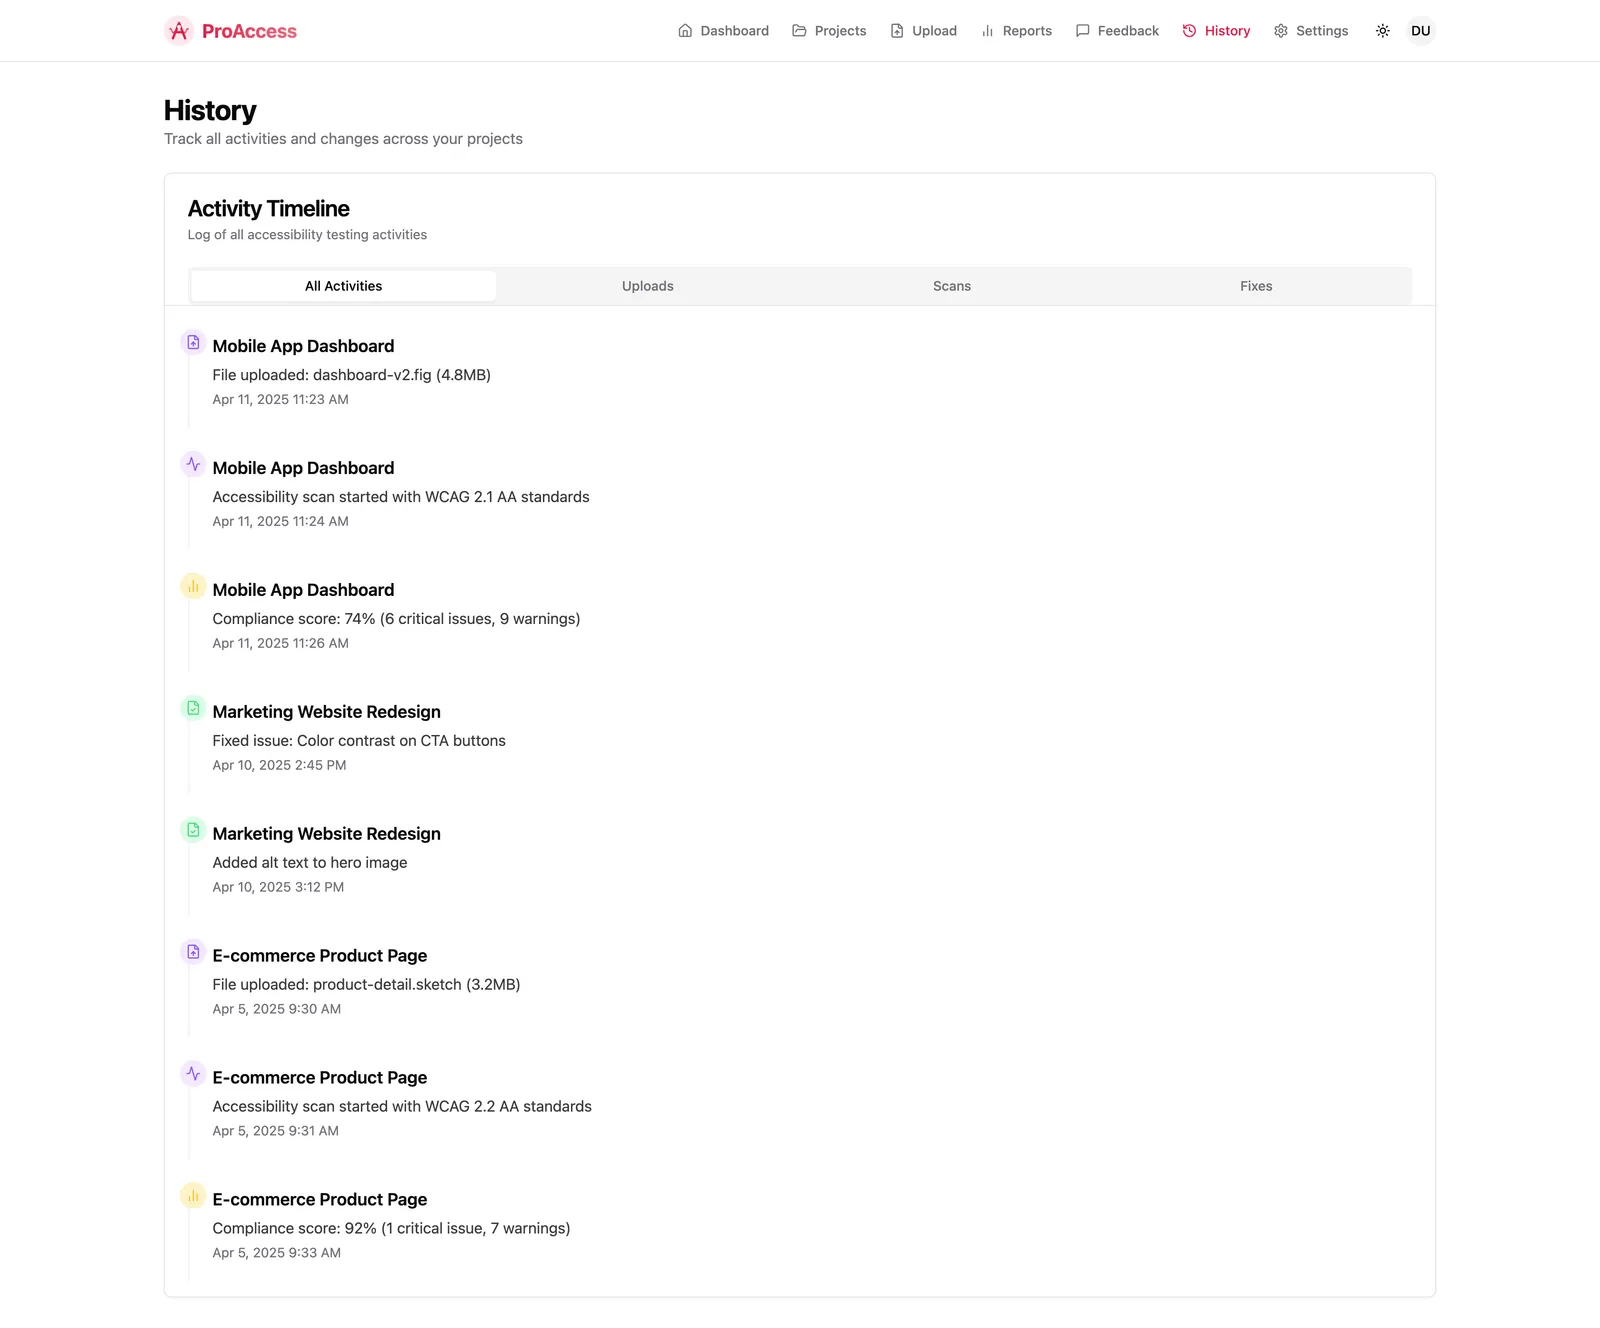 Historical data analysis with trend visualization and pattern recognition
The platform provides advanced analytics capabilities including:
Building ProAccess taught me valuable lessons about product development:
Historical data analysis with trend visualization and pattern recognition
The platform provides advanced analytics capabilities including:
Building ProAccess taught me valuable lessons about product development:
The Challenge & Solution
- Cut down reporting time through automated data collection and visualization
- Make faster product decisions with real-time access to key metrics
- Improve product quality by identifying performance bottlenecks and user behavior patterns
- Streamline team collaboration with shared dashboards and automated report distribution
Key Features
Modern analytics dashboard with real-time data visualization
- Real-time Analytics: Live data processing and visualization
- Custom Dashboards: Personalized views for different user roles
- Automated Reports: Scheduled reporting with customizable templates
- Data Integration: Seamless connection with multiple data sources
- Interactive Charts: Dynamic visualizations with drill-down capabilities
Interactive charts and graphs providing deep insights into business metrics
Advanced Reporting System
Comprehensive reporting interface with customizable parameters
The reporting system enables users to generate detailed reports with:
- Custom date ranges and filters
- Multiple export formats (PDF, Excel, CSV)
- Automated scheduling and distribution
- Template customization for branding
Performance Metrics
Performance metrics dashboard showing key business indicators
Track essential business metrics including:
- Revenue trends and forecasting
- User engagement analytics
- Conversion rate optimization
- Performance benchmarking
Data Management
Data management interface with filtering and search capabilities
Robust data management features include:
- Data quality monitoring
- Automated data cleaning
- Real-time synchronization
- Historical data archiving
Impact & Results
- Faster Decision Making: Real-time dashboards streamlined weekly review cycles
- Improved Product Quality: Early detection of performance issues through automated monitoring
- Enhanced Team Productivity: Automated reporting freed up meaningful time for strategic work
- Better Client Communication: Professional, automated reports strengthened client relationships
Technical Implementation
ProAccess technical architecture and component structure
Built with Next.js and React, ProAccess leverages modern web technologies to deliver a fast, responsive user experience. The platform uses TypeScript for type safety and maintainability, styled with Tailwind CSS for consistent design.
Advanced analytics engine with machine learning capabilities
Key Technical Features
- Server-Side Rendering: Optimized performance with Next.js SSR
- Real-time Updates: WebSocket connections for live data
- Responsive Design: Mobile-first approach with Tailwind CSS
- Data Security: Enterprise-grade security and encryption
- Scalable Architecture: Microservices-based backend
Comprehensive report view with detailed analytics and insights
Advanced Analytics
Historical data analysis with trend visualization and pattern recognition
The platform provides advanced analytics capabilities including:
- Predictive modeling and forecasting
- Anomaly detection and alerts
- Trend analysis and pattern recognition
- Custom metric calculations
Lessons Learned
- Start with your own pain points: The best products solve real problems you experience daily
- Iterate based on team feedback: Regular user testing with my team helped prioritize features
- Automate repetitive tasks: Focus on eliminating manual work that doesn't add strategic value
- Design for scalability: Building with growth in mind saved significant refactoring time